Note: Graphics containing research are listed below. Depending on your monitor size and resolution,
you may need to scroll right using your browser's horizontal navigation bar to see all the graphics.
When unduplicated headcounts for a program are low, interpret findings with caution, particularly for groups who make up a small portion of the unduplicated headcount. You can calculate the headcount for a particular demographic group by summing the unduplicated headcount for a given academic year and multiplying by the percentage headcount for that year (in decimal form). For example, if a particular program had 200 unduplicated students in fall, 200 in spring, and females made up 50% of the program headcount for that year, then the number of females would be calculated as (200 + 200) x .50 = 200. As a rule of thumb, if this headcount is below 30 be careful in interpreting findings.
Also note that the duplicated/unduplicated headcount, WSCH, estimated FTES, FTEF, productivity, and student to faculty ratio plots for the program and college-level data have different scales on the Y-Axis and may not start at zero. This may visually exaggerate small changes in the data and/or make it somewhat challenging to compare program and college-wide trends. In the case of large disparities between Y-Axis scales, it is best to focus on trends in the data labels rather than the visual/graphical depiction of the lines. All other graphs are on the same scale.
Unduplicated and duplicated headcounts for veterans reflect all registered students who were identified as veterans during or before a particular term. Because data aren't available on veteran status prior to fall 2012, headcounts from 2012-2013 academic year may be low and may not fully reflect veterans who had been enrolled prior to the 2012-13 academic year.
Collegewide:
Duplicated Headcount by Academic Term (2010-2015)Top | Human Career Development:
Duplicated Headcount by Academic Term (2010-2015)Top |
 |  |
Collegewide:
Unduplicated Headcount by Academic Term (2010-2015)Top | Human Career Development:
Unduplicated Headcount by Academic Term (2010-2015)Top |
 |  |
Collegewide:
Headcount by Age Range (2010-2015)Top | Human Career Development:
Headcount by Age Range (2010-2015)Top |
 |  |
Collegewide:
Headcount by Age Range (Collapsed) (2010-2015)Top | Human Career Development:
Headcount by Age Range (Collapsed) (2010-2015)Top |
 |  |
Collegewide:
Headcount by Gender (2010-2015)Top | Human Career Development:
Headcount by Gender (2010-2015)Top |
 |  |
Collegewide:
Headcount by Ethnic Group (2010-2015)Top | Human Career Development:
Headcount by Ethnic Group (2010-2015)Top |
 |  |
Collegewide:
Headcount by Educational Goal (2010-2015)Top | Human Career Development:
Headcount by Educational Goal (2010-2015)Top |
 |  |
Collegewide:
Headcount by Educational Level (2010-2015)Top | Human Career Development:
Headcount by Educational Level (2010-2015)Top |
 |  |
Collegewide:
Headcount by Instructional Mode (2010-2015)Top | Human Career Development:
Headcount by Instructional Mode (2010-2015)Top |
 |  |
Collegewide:
Headcount by Course Level (2010-2015)Top | Human Career Development:
Headcount by Course Level (2010-2015)Top |
 |  |
Collegewide:
Headcount by Freshman Status (2010-2015)Top | Human Career Development:
Headcount by Freshman Status (2010-2015)Top |
 |  |
Collegewide:
Headcount by Primary Language (2010-2015)Top | Human Career Development:
Headcount by Primary Language (2010-2015)Top |
 |  |
Collegewide:
WSCH by Academic Term (2010-2015)Top | Human Career Development:
WSCH by Academic Term (2010-2015)Top |
 |  |
Collegewide:
ESTIMATED FTES by Academic Term (2010-2015)Top | Human Career Development:
ESTIMATED FTES by Academic Term (2010-2015)Top |
 |  |
Collegewide:
FTEF by Academic Term (2010-2015)Top | Human Career Development:
FTEF by Academic Term (2010-2015)Top |
 |  |
Collegewide:
Productivity (WSCH/FTEF) by Academic Term (2010-2015)Top | Human Career Development:
Productivity (WSCH/FTEF) by Academic Term (2010-2015)Top |
 |  |
Collegewide:
Student to Faculty Ratio (ESTIMATED FTES/FTEF)Top | Human Career Development:
Student to Faculty Ratio (ESTIMATED FTES/FTEF)Top |
 |  |
Collegewide:
Success Rate by Academic Year (2010-2015)Top | Human Career Development:
Success Rate by Academic Year (2010-2015)Top |
 |  |
Collegewide:
Success Rate by Age Range (2010-2015)Top | Human Career Development:
Success Rate by Age Range (2010-2015)Top |
 |  |
Collegewide:
Success Rate by Age Group (2010-2015)Top | Human Career Development:
Success Rate by Age Group (2010-2015)Top |
 |  |
Collegewide:
Success Rate by Gender(2010-2015)Top | Human Career Development:
Success Rate by Gender(2010-2015)Top |
 |  |
Collegewide:
Success Rate by Ethnic Group (2010-2015)Top | Human Career Development:
Success Rate by Ethnic Group (2010-2015)Top |
 |  |
Collegewide:
Success Rate by Educational Goal (2010-2015)Top | Human Career Development:
Success Rate by Educational Goal (2010-2015)Top |
 |  |
Collegewide:
Success Rate by Educational Level (2010-2015)Top | Human Career Development:
Success Rate by Educational Level (2010-2015)Top |
 |  |
Collegewide:
Success Rate by Instructional Mode (2010-2015)Top | Human Career Development:
Success Rate by Instructional Mode (2010-2015)Top |
 |  |
Collegewide:
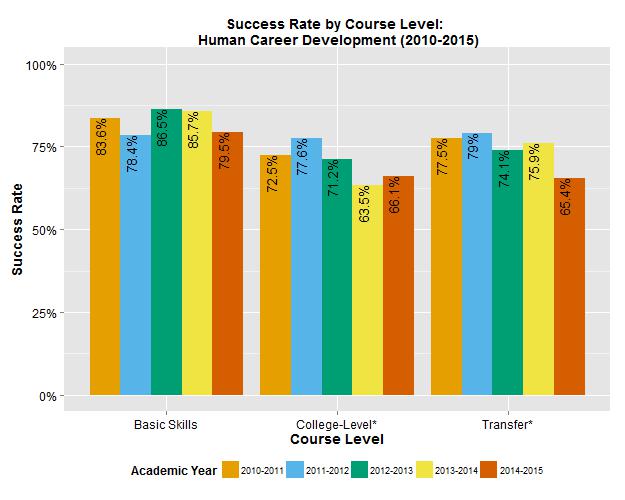
Success Rate by Course Level (2010-2015)Top | Human Career Development:
Success Rate by Course Level (2010-2015)Top |
 |  |
Collegewide:
Success Rate by Freshman Status (2010-2015)Top | Human Career Development:
Success Rate by Freshman Status (2010-2015)Top |
 |  |
Collegewide:
Success Rate by Primary Language (2010-2015)Top | Human Career Development:
Success Rate by Primary Language (2010-2015)Top |
 |  |